Trading involves substantial risk of loss and is not suitable for all investors. Past performance is not indicative of future results. Opinions, market data, and recommendations are subject to change at any time. The views and opinions expressed on this web site and all live and recorded DayTradingRadio.com videos and audio recordings are soley those of the original authors and other contributors. These views and opinions do not necessarily represent those of DayTradingRadio.com or its staff, and or any or all contributors to this site.
The Tradeometer is my favorite way to identify tradeable zones in the market related to the S&P. It has been back tested enough to see the obvious results are staggering when the alert is combined with the trend or channel lines, volume profile areas (which are always identified on the chart in orange) market support and resistance areas which are also plotted on the chart.
Any of those combinations of indicators is always an HPS Setup. I consider the Tradeometer and channel or trend lines and the volume profile areas to be highest on my list personally.
The Tradeometer is a timing tool that works best in an environment that has no news that could push the markets to a extreme bullish or bearish zone. These are where most automated trading systems that use a counter trend strategy start to fail. The Tradeometer is not an auto pilot buy and sell signal. It is a confirmation or an additional HPS indicator added to any of the other 5 indicators and should be used in conjunction with them.
This is an entry and short term scalping tool for both longs and shorts. Exits are not identified and those depend on market environment and longer term outlook and chart. When I say longer term, I am still very short term, but 5 min chart will mostly be used to capture more of a extended move. More on exit strategies later.
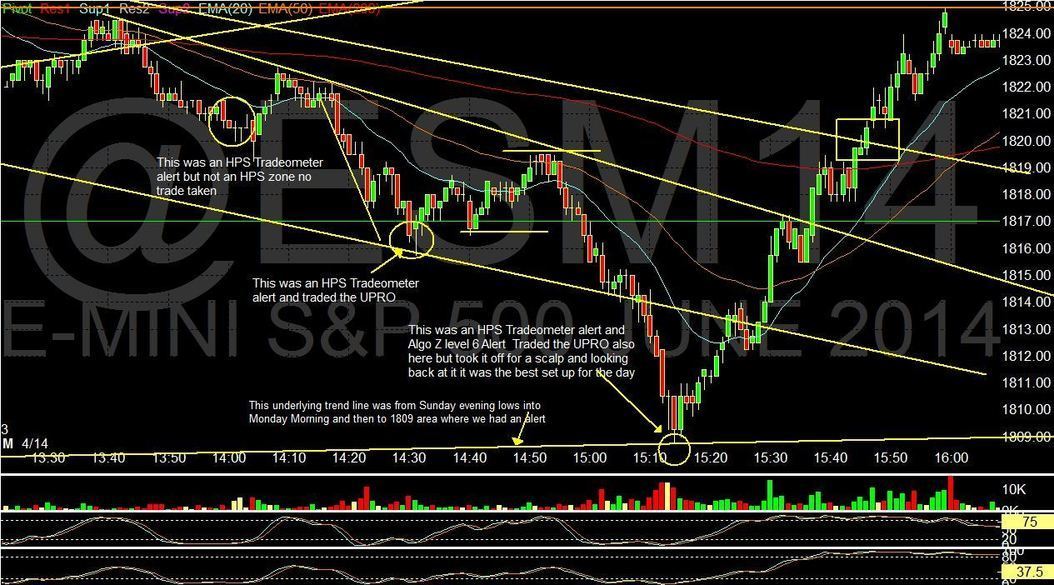
The chart below shows how each buy alert was followed by a move. Each move varied in distance and follow through. Remember this chart because you will see this market reacts to those moving averages 20,50, and 200 time and time again. These moving averages will be key in your exit strategy.
In each case, I only took the trade when the Tradeometer signals on the trend line. Each case will be different and in some cases the market will be pressured up or down past any alerts. If that pressure seems obvious or feels looming, then paper trade it and add it to your statistics and save that tums for the next time.
I recorded a few videos explaining the Tradeometer in action. They will give you a better feel for what to look for and the confidence I have in this alert. With an adjustment made on the overnight data was skewing the early morning alerts. The indicator is dialed in perfect for me now and will really use it going forward.
This videos are unedited and raw but worth watching if you want to get ready for next week. The first video outlining the early buy signals seems to be corrupted and I had to delete it the videos pick up on the sell signal around noon.
My most important Rules when using the Tradeometer to take a Trade
The Tradeometer works great on it's own but it also confirms and works excellent with other indicators. Here are the best combinations to use and How I use them trading.
The Top 5 Indicators to pair with a Tom Signal.
1. Volume profile Zones; volume profiling techniques to discover key support / resistance levels on any timeframe.The Volume Profile indicator constructs a price / volume profile of the trading activity for an instrument over a specified time period. The indicator plots the profile as a vertical histogram, i.e. showing the volume at specific price levels. I plot these each week on our charts shared with members of DTR by Futurestrader71. They a plotted with Orange Lines on the chart.
2. Trend Lines: An established Trend line is one that has at least 2 reference point or (Pivots) the line continues and the Trade takes place as the Tradeometer alert signals and the Trend line is being tested. The Trend lines could be downward sloping or rising each situation can be traded. I prefer a buy signal into a declining trend line.
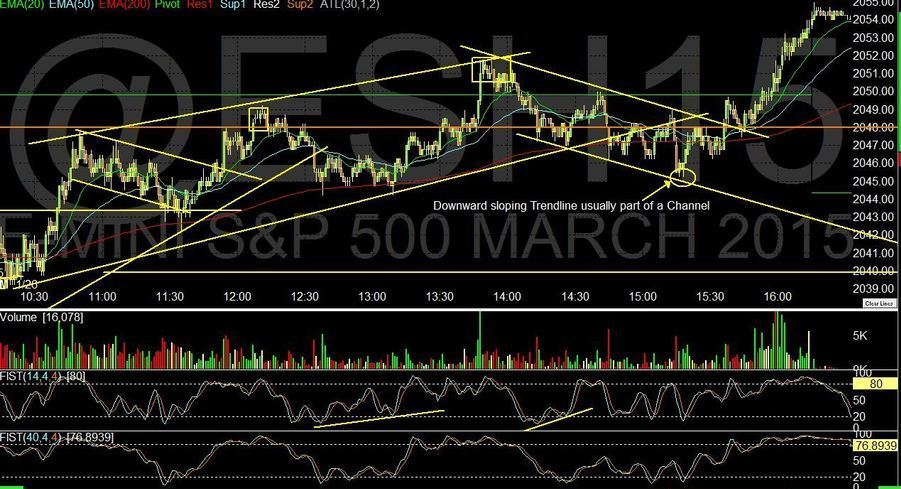
3. Recognizable Patterns: There are a few patterns that are worth watching out for and that work great with the Tradeometer. In the above chart we have a Channel that was formed by the multiple pivots on the chart. A pivot is where the market makes a rotation from going from one drirection to the opposite. These line up on both sides of a move and the space between them is equal distance. The 1-2-3 Pattern is perfect for identifying the channel and letting the alert trigger as the channel line is tested.

$6.99 for the first 7 days
$49.95/ Month
Members of www.Daytradingradio.com can purchase the receive for $34.97
or receive it free with a yearly of lifetime membership.
Trading the markets takes precise timing and discipline. Over the last 20 years I have realized and established a lot of rules to help traders have an edge. I teach the discipline and stress the patience needed to get an edge to be successful in a environment that is fast and sometimes irrational. As the saying goes hindsight is 20/20. Meaning it's easy to show you the chart after the day is done and point out the best areas to trade, and I have been in this carreer long enough to know that's how a lot of analyst and educator work. I always strived to "Real Time Educate" show where the moves in the market have the highest probablity of reacting and do it live and real time. The Tradeometer is the result of years of testing and combining all my formulas into one timing "meter" Our team has developed this tool to help time the markets and point out the "Highest" Probability area to trade . It is a scalping tool that can be used by futures and stock traders.
How Will The Tradeometer Help Me Trade?
One of the greatest mistakes a trader can make is over trading the Tradeometer takes in consideration multiple time frames and waits till there are signals triggered on each time frame so it give you best possible entry.
The Tradeometer looks at both overbought and oversold levels giving both long and short opportunities.
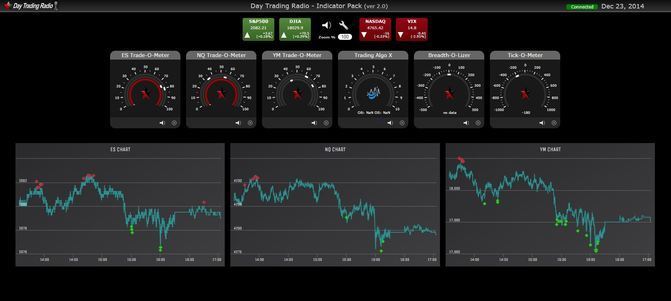
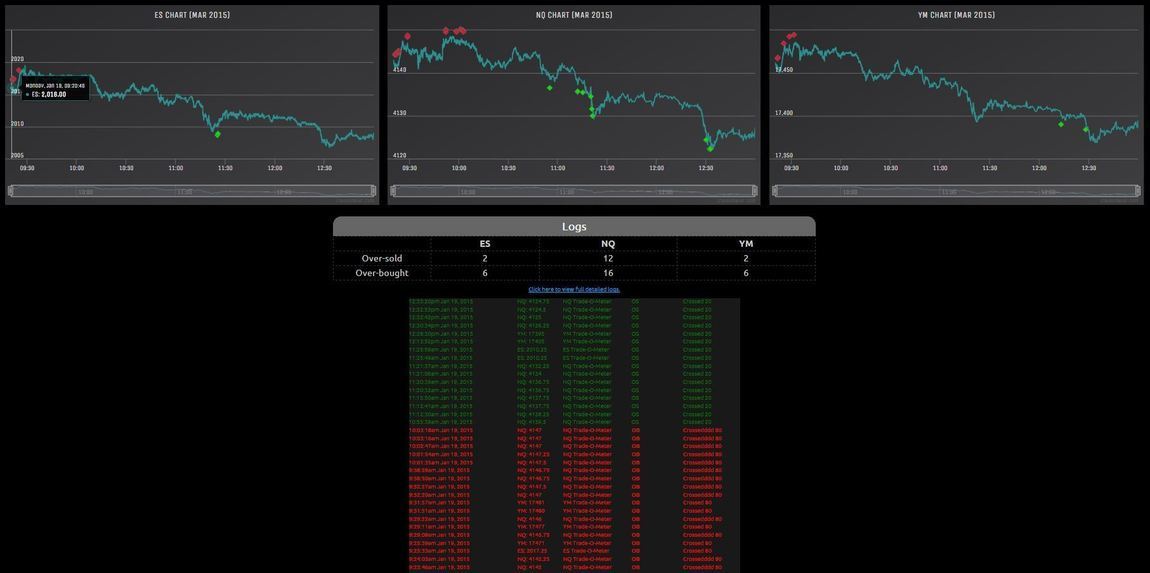
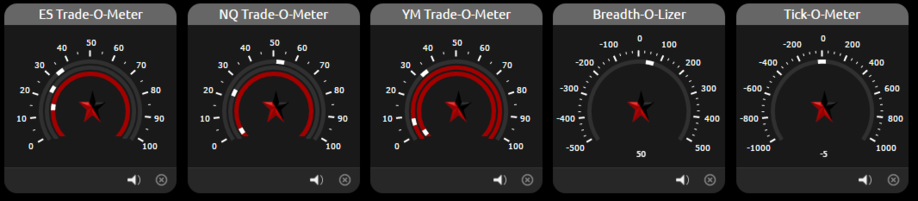
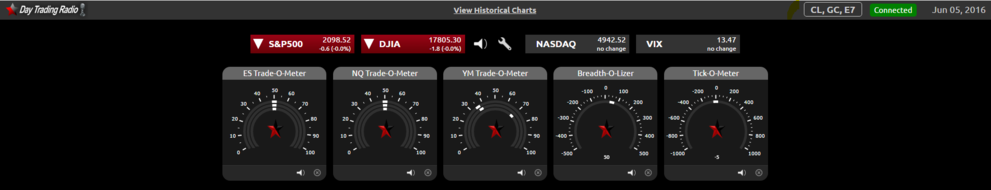
We expanded the Tradeometer to cover the NQ's and YM along with the ES Futures. Giving you more options and showing you more information like divergences, and Relative weakness and strength.
Traders don't have to trade futures, The signals given work just as well with the index tracking etf's (SPY, SPXU, SSO, UPRO, QQQ, ect)
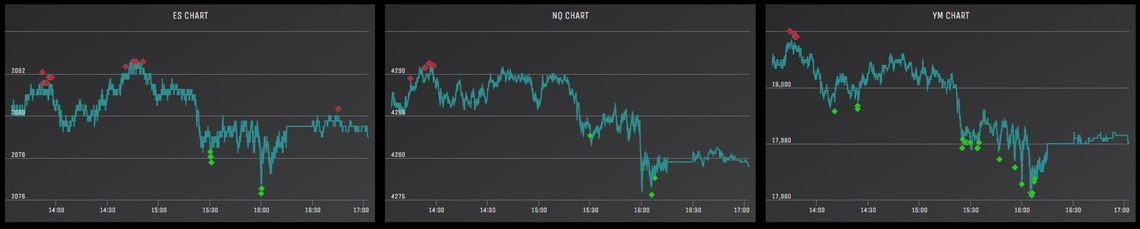
Each alert is plotted on the live real time chart and the alert also has an audio and visual indicator to inform you of a possible setup. Each chart also has it's individual controls. You can mute or even remove the chart if you do not trade it and want to focus on just one or two fo the future contracts. The live plotting is such agreat feature as you can look back at the day and see how the alerts played out. As you get familiar with the program you will notice some days there will be more alerts on one contract versus the others. This is an indicator in itself as you might want to trade the contract that is less volatile.
Plotted Real Time Alerts
Another great feature is every alert is archived and logged in a detailed section under the charts. Something special came out of this and it also acts as a key market timing tool. As you can see under here the capture of the detailed alerts there is a clear division between overbought and oversold alerts, This division marked the change of trend in the market. You can use this data as youy see fit, but the little things like this could easly help your analysis of themarket and how you want to trade it.
YM Tradeometer is best used with Dow Futures, DIA, DIA Options or any etf that tracks ther Dow.
DDM, UDOW
NQ Tradeometer is best used with Nasdaq Futures, QQQ, QQQ Options, or any etf that tracks the Nasdaq.
QLD, TQQQ,
ES Tradeometer is best used with Emini Futures, Spy, Spy Options, or any etf that tracks the S&P.
SSO, UPRO, UVXY, SPUU, SPXL
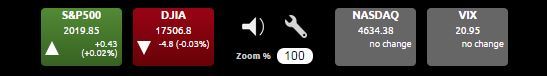
Market Breadth is the ratio that compares the total of rising stocks to the total number of falling stocks
Tick-o-Meter measures the stocks trading on an uptick minus the number of stocks trading on a downtick
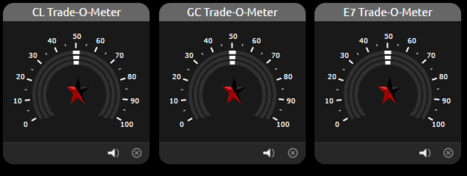

We had so many request to add the Crude Futures (CL)to the Tradeometer we did that and also added Gold (GC) and the Euro FX (E7). This is a major upgrade and opens up many more profitable opportunities.
Click here to change over to CL, GC, and E7
The Tradeometer can be used trading many different products.